Project: MooWheel
-
Project Type
Open Source
-
Date
May 2008
-
Skills
JavaScript, HTML5
-
Goals
- Build a JavaScript library to create a useful data visualization.
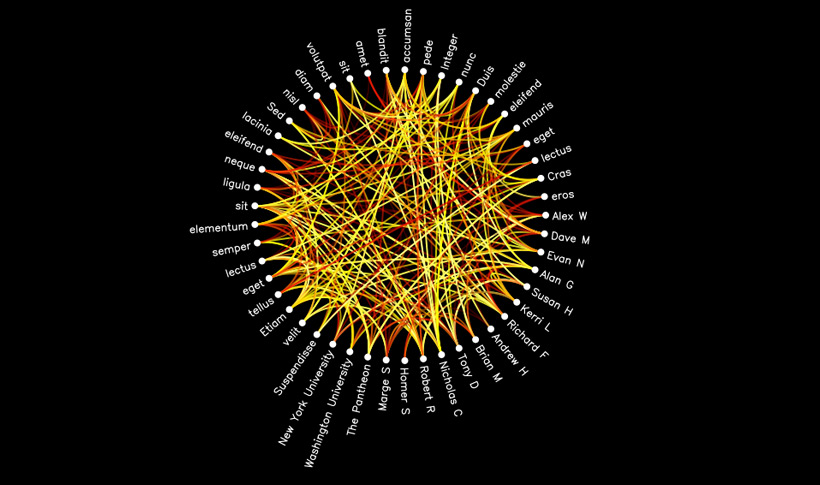
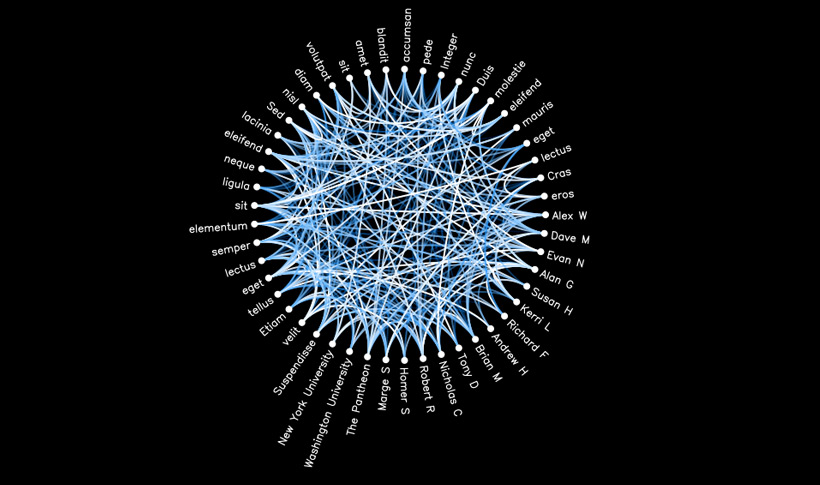
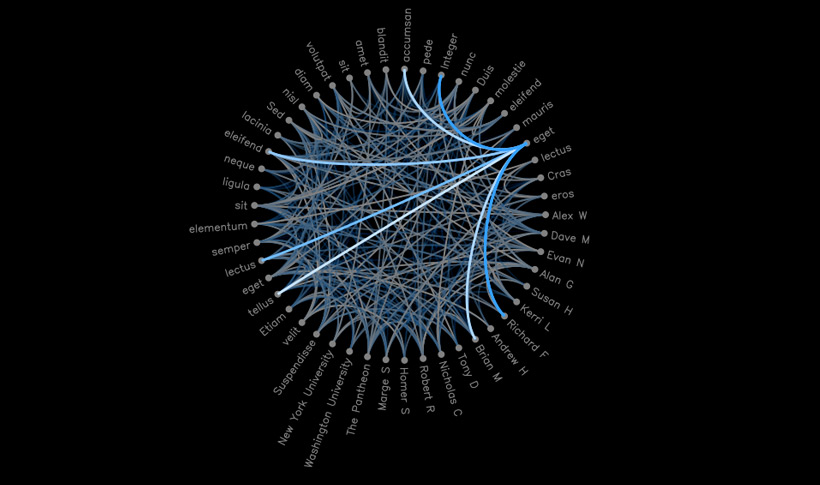
Description
MooWheel created a circular data visualization allowing a user to easily and clearly show the connections between elements in a group. It used the canvas element and was implemented with the MooTools JavaScript library.